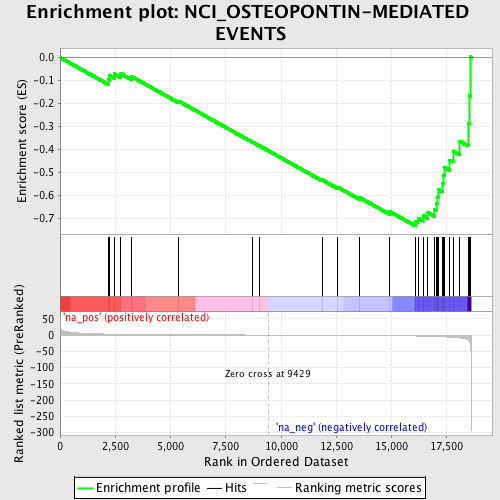
Profile of the Running ES Score & Positions of GeneSet Members on the Rank Ordered List
| Dataset | set04_transDMpreB_versus_WTpreB |
| Phenotype | NoPhenotypeAvailable |
| Upregulated in class | na_neg |
| GeneSet | NCI_OSTEOPONTIN-MEDIATED EVENTS |
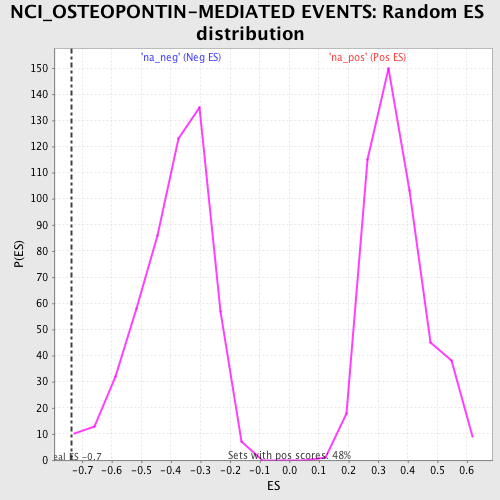
| Enrichment Score (ES) | -0.734183 |
| Normalized Enrichment Score (NES) | -1.8813603 |
| Nominal p-value | 0.0057581575 |
| FDR q-value | 0.58827174 |
| FWER p-Value | 0.949 |
| PROBE | GENE SYMBOL | GENE_TITLE | RANK IN GENE LIST | RANK METRIC SCORE | RUNNING ES | CORE ENRICHMENT | |
|---|---|---|---|---|---|---|---|
| 1 | MAPK8 | 2179 | 3.027 | -0.0961 | No | ||
| 2 | CHUK | 2221 | 2.966 | -0.0776 | No | ||
| 3 | ROCK2 | 2452 | 2.667 | -0.0714 | No | ||
| 4 | CD44 | 2747 | 2.393 | -0.0705 | No | ||
| 5 | ITGB3 | 3235 | 2.001 | -0.0827 | No | ||
| 6 | MMP9 | 5379 | 1.053 | -0.1906 | No | ||
| 7 | BCAR1 | 8716 | 0.180 | -0.3689 | No | ||
| 8 | FOS | 9018 | 0.107 | -0.3843 | No | ||
| 9 | PIK3R1 | 11865 | -0.608 | -0.5332 | No | ||
| 10 | MAP3K14 | 12563 | -0.819 | -0.5650 | No | ||
| 11 | MMP2 | 13564 | -1.154 | -0.6107 | No | ||
| 12 | RAC1 | 14926 | -1.756 | -0.6717 | No | ||
| 13 | ILK | 16089 | -2.770 | -0.7149 | Yes | ||
| 14 | GSN | 16198 | -2.906 | -0.7004 | Yes | ||
| 15 | PIK3CA | 16426 | -3.246 | -0.6899 | Yes | ||
| 16 | PLAU | 16648 | -3.652 | -0.6763 | Yes | ||
| 17 | ITGAV | 16941 | -4.232 | -0.6625 | Yes | ||
| 18 | MAP3K1 | 17023 | -4.458 | -0.6357 | Yes | ||
| 19 | RELA | 17065 | -4.586 | -0.6059 | Yes | ||
| 20 | JUN | 17135 | -4.762 | -0.5764 | Yes | ||
| 21 | PIP5K1A | 17292 | -5.199 | -0.5485 | Yes | ||
| 22 | MAPK3 | 17335 | -5.344 | -0.5135 | Yes | ||
| 23 | NFKB1 | 17383 | -5.487 | -0.4777 | Yes | ||
| 24 | NFKBIA | 17625 | -6.306 | -0.4467 | Yes | ||
| 25 | MAPK1 | 17787 | -6.868 | -0.4074 | Yes | ||
| 26 | SYK | 18076 | -8.451 | -0.3639 | Yes | ||
| 27 | PTK2B | 18476 | -14.219 | -0.2861 | Yes | ||
| 28 | VAV3 | 18521 | -17.543 | -0.1660 | Yes | ||
| 29 | SPP1 | 18561 | -24.511 | 0.0030 | Yes |